With Bitcoin’s (BTC) close price on the last day being $26.33k, the lowest level in 70 days, the crypto market is flooded with dark clouds. The biggest crypto exchange by trading volume, Binance (BNB) was affected sharply by Bitcoin’s fall.
The BNB price fell by 2.39% last day but shows a promising pattern and breakout opportunity if the buyers manage to retain the $300 level. Read the entire article to understand why this is the time to buy when there is blood in the crypto street.
Key Takeaways:
- Binance moves out of Canada and BNB continues to take the hit, falling by double digits last month.
- A falling wedge appears in the BNB chart, a hint toward a bullish reversal.
- The 24-hour trading volume in the BNB is $401 Million.

Source – TradingView
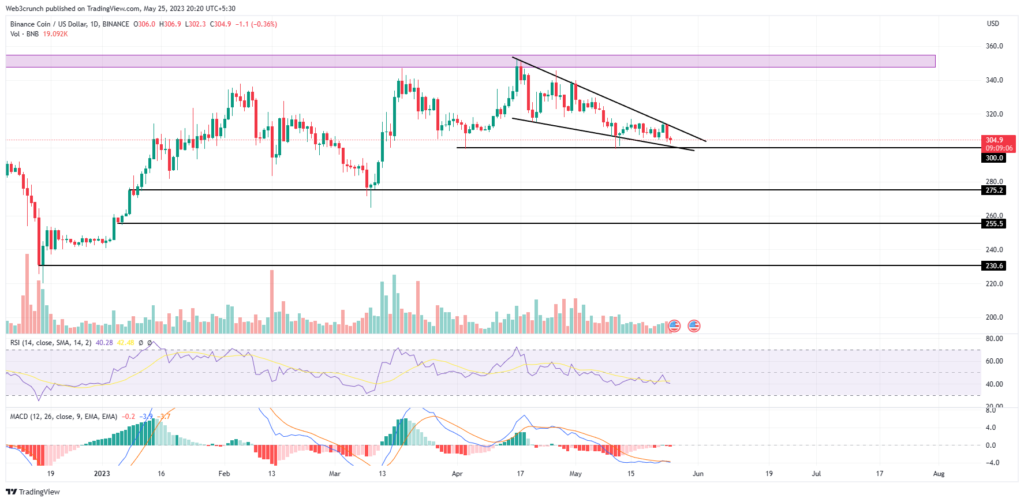
The BNB price trend continues to fall over the last few weeks. The prices are down by 12% in the last 38 days. The downtrend takes the shape of a falling wedge pattern in the daily chart.
However, the trading volume over the same period is also declining which projects a weakness in the spirit of sellers. This can help the buyers regain trend control.
The bearish turnaround from the highlighted supply zone at $350 has resulted in a huge discount in the BNB prices as it trades at $304.9, at press time. With an intraday fall of 0.39%, a lower price rejection bearish candle is seen.
The preliminary BNB technical analysis showcases a growing intensity of the bearish trend in motion. However, the lower price rejection forming today takes support within the wedge. This increases the chances of a bullish turnaround.
The levels in our technical chart display crucial support levels at $300 and $275. From a positive perspective, the wedge breakout rally may face slightly to no resistance before $350.
Technical Indicator:
RSI indicator: The RSI line maintains a declining trend as the BNB prices trend lower in a wedge pattern.
MACD: The MACD lines maintain a sideways trend but the premise of a bullish crossover is sky-high. Therefore, the overall signal from the technical indicators remains optimistic and gives a potential bullish reversal signal for Binance (BNB).
Recommendation:
Considering the high possibility of a bullish reversal in Binance Coin (BNB) price action, it is advisable for traders to monitor the wedge breakout. Once a candle closes above the $315 mark, it would signal a strong entry point for a bullish position. This breakout rally is expected to challenge the $350 level.
However, it is crucial for traders to exercise caution and wait for confirmation through price action before entering any bullish positions. This ensures a higher probability of success in the trade.
In the event that the market sentiment gets worse and the BNB fails to materialize the breakout, there is a possibility of a prolonged selling spree. This scenario could lead to a significant decline in BNB prices, with a potential target of $275.

Vishal Dixit, a Mumbai-based crypto writer and analyst, excels in crafting engaging, SEO-friendly crypto-related content. His key strengths lie in technical and fundamental analysis of stocks and cryptocurrencies, alongside a robust understanding of content strategy and management systems. His interests extend beyond crypto to chess, movies, gym, and trekking, reflecting his multi-dimensional personality.


